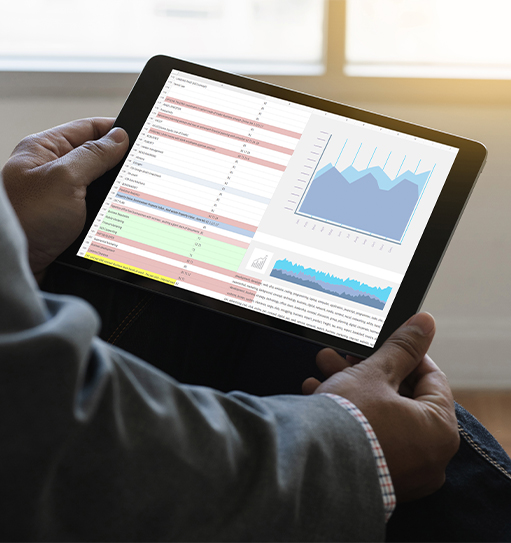


Real-time clarity. One trusted view. Faster, confident decisions. Wiseboard Executive is a plug-and-play executive intelligence platform that empowers leaders to instantly make sense of complex data.
Wiseboard Executive consolidates financial and operational data into a single "cockpit" providing senior management with a reliable and instant view. With a proven Financial Data Warehouse (DWH) model, self-service BI, and automated controls, the platform ensures all key performance indicators (KPIs) are consistent, verifiable, and trend-aware.
The platform ingests both structured and unstructured data from multiple ERP and source systems. It then validates results with automated anomaly and data-control rules. The outcome is a single, verified source that turns high-level tracking into reliable, actionable insights.
Launch with predefined dashboards and a catalog of over 100 ready-to-use KPIs, eliminating lengthy analysis and development cycles.
Monitor essential financial indicators such as the Income Statement, Balance Sheet, and Net Working Capital from a single screen
Instantly track operational processes with data on expenses, product sales, and profitability.
Ensure the consistency and accuracy of data with automated cross-checks and validation rules.
Empower business units to easily create their own custom reports, reducing dependency on technical teams.
The subject-area data mart design allows for the easy addition of new data sources and topics as the organization evolves.
Role-based authorization ensures that each user accesses only the data they should, while offering mobile-compatible and platform-independent access.

Wiseboard Executive is designed for top-level executives at large-scale corporations and holdings. Organizations in diverse sectors such as finance, retail, energy, and sports can use Wiseboard Executive to monitor financial performance, operational efficiency, and strategic goals.

Wiseboard Executive eliminates reporting cycles that can take months. The platform can be deployed in as little as 15 days, allowing for rapid time-to-value.

Operations are based on a single, verified data source. Since reports and KPIs are consistent and auditable, decisions are always defensible.

The system transforms data management into a strategic tool for senior leadership. The focus shifts from reconciling numbers to defining the next course of action.
Cockpit - summary is the high-level executive dashboard. It provides a quick, at-a-glance summary of the most important KPIs and metrics, allowing leadership to get a rapid sense of the business's overall health and performance.
Income statement and profitability focuses on the revenue, expenses, and profitability of the business. It provides detailed analysis of income, costs, gross and net profit and EBITDA, helping leaders understand the key drivers of financial performance.
Balance sheet provides a detailed view of the company's assets, liabilities, and equity. It helps management assess the company’s financial stability, liquidity and capital structure.
Sales module tracks sales performance across various dimensions. It can provide insights into gross sales, net sales, revenue per order and other sales-related KPIs, helping sales teams and executives understand what's working and where there are opportunities for improvement.
This feature allows for a detailed analysis of operational costs. It breaks down expenses by category (e.g., personnel, marketing, travel), enabling a deeper understanding of spending and providing the data needed to make cost-cutting decisions.
Net business capital provides an overview of the company's working capital. It helps management analyze key components such as accounts receivable, accounts payable and inventory, ensuring there is sufficient capital to support ongoing operations.
This feature provides crucial human resources data. It tracks information such as total employee count, average cost per employee and personnel expenses, giving management visibility into one of the largest areas of business spending.
With the experience gained by involving in the digital world for 23 years, we provide technology and data science support to businesses from every industry; we add value by facilitating their processes.
In Symphony Labs, we are commissioning all financial and banking activities with BaaS and marketplace infrastructure, which does not require any infrastructure investment.
It can enable users to become Credin customers and make it possible to query customer information with a customer number and T.R. Identity Number.
The payment schedule of the loans received from Credin can be easily viewed and monitored.
User's invoices from many organizations are quickly queried and paid.
Data Warehouse Model (3NF) specific to financial follow-up (tested and optimized)
Integration with many different ERP applications.
Multi-layer data model (STG, Datamart, Derived Layers)
Ability to receive data from different applications with Staging/Landing Zone.
Intermediate layer where atomic and all historical data can be kept and reported.
Ability to retrieve data from structured and unstructured systems.
Ready ETL infrastructure and Mappings/Packages.

To provide the best experiences, we use technologies like cookies to store and/or access device information. Consenting to these technologies will allow us to process data such as browsing behavior or unique IDs on this site. Not consenting or withdrawing consent, may adversely affect certain features and functions. Cookie Policy