
Silent Attrition: The Hidden Cost of Banking Churn

A customer can walk away from a bank almost entirely without ever closing an account. The paycheck moves to a different bank, savings drift into a fintech app, card spending shifts to a competitor’s card, and the old account stays open with a few dollars sitting in it. In banking, this is called silent attrition, and most of the churn numbers banks report never see it.
Because it doesn’t match the textbook definition of “the customer closed their account,” silent attrition doesn’t show up as a loss in standard reporting. But the effect on revenue is real: balances shrink, transaction volume drops, and cross-sell opportunities disappear. This piece looks at what silent attrition actually is, why banks miss it, which signals expose it, and how those signals can be turned into a working scoring practice.
What Is Silent Attrition?
Explicit churn is a clean event: the customer closes the account, cancels the card, signs the form. It’s easy to measure because it’s a single, dated transaction that shows up in the system immediately and rolls straight into the monthly churn number.
Silent attrition works differently. The customer never formally ends the relationship; they just shrink it. The paycheck moves to another bank, but the old account stays open to hold a small balance. Investment products drift to a fintech app. Card spending shifts to a competitor’s card. What’s left is an account that looks active in the system but is economically hollowed out. Picture a customer who once held a paycheck account, a credit card, and a small investment account, and who over a couple of years ends up with nothing but a low-balance checking account left behind; this is an illustrative pattern, not a specific case, but it’s one that shows up repeatedly across industry sources.
The industry sometimes calls this “silent switching,” or simply silent churn; the term used most consistently in English-language sources is silent attrition. The common thread is always the same: the customer still counts as “active” in the system, while the economic relationship with the bank has already thinned out considerably. The account is open. The relationship, in practical terms, is not.
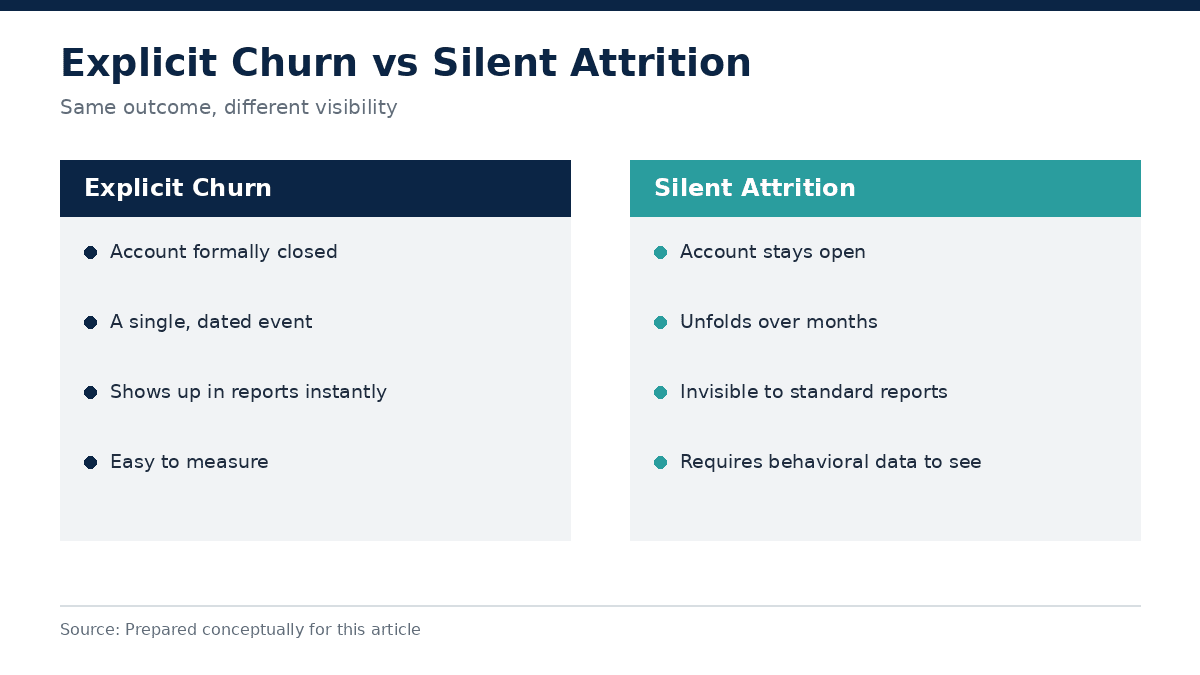
Explicit churn is a single event; silent attrition unfolds over months.
Why Do Banks Miss It?
The root of the problem is measurement. Most banks track churn with a single blended rate: accounts closed during a period divided by total accounts. The standard formula is: (customers lost during the period / total customers at the start of the period) x 100. That calculation only counts customers who actually closed an account; a customer whose balance has quietly drained away while the account stays open never enters the denominator.
That blended view also masks cohort-level differences. Younger customer segments evaluate their primary banking relationship far more actively than older cohorts, who tend to hold the aggregate number steady. The result: the dashboard says “everything is fine” while the bank’s most valuable growth segment is quietly slipping away.
The second issue is where the data sits. As long as an account stays open, most CRM and reporting systems keep flagging that customer as “active.” Signals like a declining balance, reduced transaction frequency, or recurring outbound transfers sit in separate tables; unless someone combines and interprets them, no alarm ever fires. The credit team looks at one dashboard, the digital channel team looks at another, branch operations looks at a third; none of them sees the full picture on its own.
The third issue is organizational. By definition, silent attrition belongs to no single department. It never reaches the retention team’s radar because the account never closes, and it’s rarely a sales priority because the balance shrinking isn’t dramatic enough to trigger urgency. That gap between teams is exactly what lets the problem grow unnoticed for years.
What Do the Numbers Say?
Industry data suggests that annual customer attrition in banking runs somewhere between 15% and 25%, with rates climbing to three times that for accounts open less than six months. This figure comes from the US market and only counts accounts that actually closed; if dormant accounts were factored in, the picture would likely look considerably worse.
The impact is easier to grasp with a concrete example: at a US bank with $50 billion in assets, every one-point increase in the attrition rate can translate into roughly $12 million in lost annual net interest income. Scaled down to a mid-sized bank in Turkey, the exact figures would differ, but the mechanism is identical: shrinking balances, falling interest income, lost cross-sell potential.
A single case described by a banking consultant makes the scale of the problem more concrete. At a $10 billion US institution, analysis found that 64% of customers held an account elsewhere in a product category the bank itself offered; more than 30% of that group had three or more deposit relationships at other institutions. Looking at transaction data, 37% of customers were making a recurring transfer (not a payment, an actual transfer) to a competing institution every month. That institution’s reported churn rate sat under 3%; its actual silent attrition was an order of magnitude larger. This is one institution’s own analysis, not a generalizable industry average, but the method it used is repeatable: scan existing product categories for external relationships and recurring outbound transfers.
Which Signals Actually Matter?
Catching silent attrition doesn’t require exotic technology; it requires asking the right questions of transaction data banks already collect. In practice, a handful of signals do most of the work.
Average balance trend. Not a single low month, but a sustained decline across several months, especially when it coincides with a paycheck or recurring deposit disappearing.
Recurring outbound transfers. Not bill payments or purchases, but transfers to the same external account at regular intervals. This behavior is one of the strongest indicators that money is now being held somewhere else.
Narrowing product usage. A customer who once used a credit card, an investment account, and a deposit account, now left with nothing but a dormant checking account.
Declining digital engagement. A drop in mobile app login frequency, or falling below a defined threshold (say, 60-90 days), becomes meaningful especially when it shows up alongside other signals.
Unresolved complaints. A drop in transaction volume shortly after a complaint can be an indirect sign that the complaint was never actually resolved.
Cohort-level breakdown. Younger, digitally-oriented segments showing switching-evaluation behavior at rates well above the blended average.
None of these signals is conclusive on its own. A balance can dip for a month, a customer can make one large one-off purchase, app usage can drop during a vacation. But a customer showing three or four of these signals at once has entered a risk profile that warrants active outreach, even if they haven’t technically met the formal definition of churn yet.
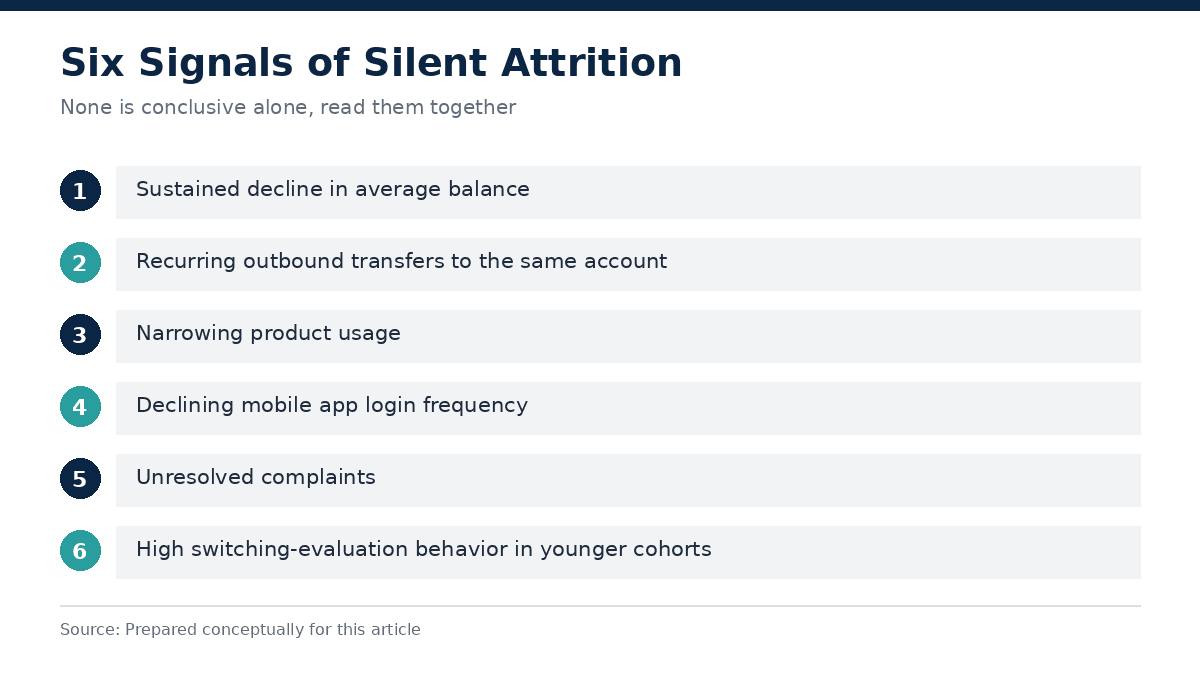
None of the six signals is conclusive alone; they need to be read together.
Churn Risk and Churn Rate Are Not the Same Thing
It’s worth clearing up a terminology mix-up here. Churn rate is a backward-looking metric: it reports the percentage of customers lost during a defined period. Churn risk is a forward-looking prediction: a probability score for whether a given customer is likely to churn in the future. This is exactly where the silent attrition discussion matters most: a bank that only tracks the backward-looking rate will never see a customer who hasn’t closed their account yet but is already at high risk. Moving risk earlier means turning the behavioral signals above into a score.
Is Graph Analytics Necessary?
Some industry commentary argues that catching silent attrition requires moving to graph analytics: modeling customer, product, channel, and interaction data as a relationship network to surface connections standard tabular analysis can’t see. For complex, multi-institution relationship patterns, that approach adds real value, particularly in commercial banking, where a single corporate client may hold complicated relationships across several banks at once.
But for most of retail banking, it isn’t a prerequisite. Most of the signals listed above can already be detected once existing transaction data is properly modeled in a data warehouse with the right behavioral indicators added, without standing up a separate graph database layer. The critical point is that the data stops sitting in scattered tables and gets consolidated into one consistent layer that’s scored regularly. Graph analytics can be a useful next step for very complex corporate customer networks, but it isn’t the starting point. For most banks, the priority should be consolidating the scattered signals already sitting inside the existing DWH/BI stack.
Turning It Into a Scoring Practice: Four Steps
Detecting signals and turning them into an operational process are two different things. In practice, a four-step approach tends to work.
The first step is data consolidation. Balance, transaction, digital channel, and complaint data need to be visible in one layer, under one consistent customer identity. This is usually the most time-consuming step, but also the most critical one, since nothing downstream works well on scattered data.
The second step is defining behavioral indicators. The six signals above are a starting point; every bank needs to calibrate its own thresholds (say, a 20% balance decline, or 90 days without a login) against its own customer base.
The third step is scoring and prioritization. Signals shouldn’t be evaluated one at a time; customers showing multiple signals simultaneously should move to the top of the priority list.
The fourth step is triggering action. Once a score crosses a defined threshold, that information needs to flow automatically into the CRM or campaign system; otherwise detection stays a report that never turns into an intervention.
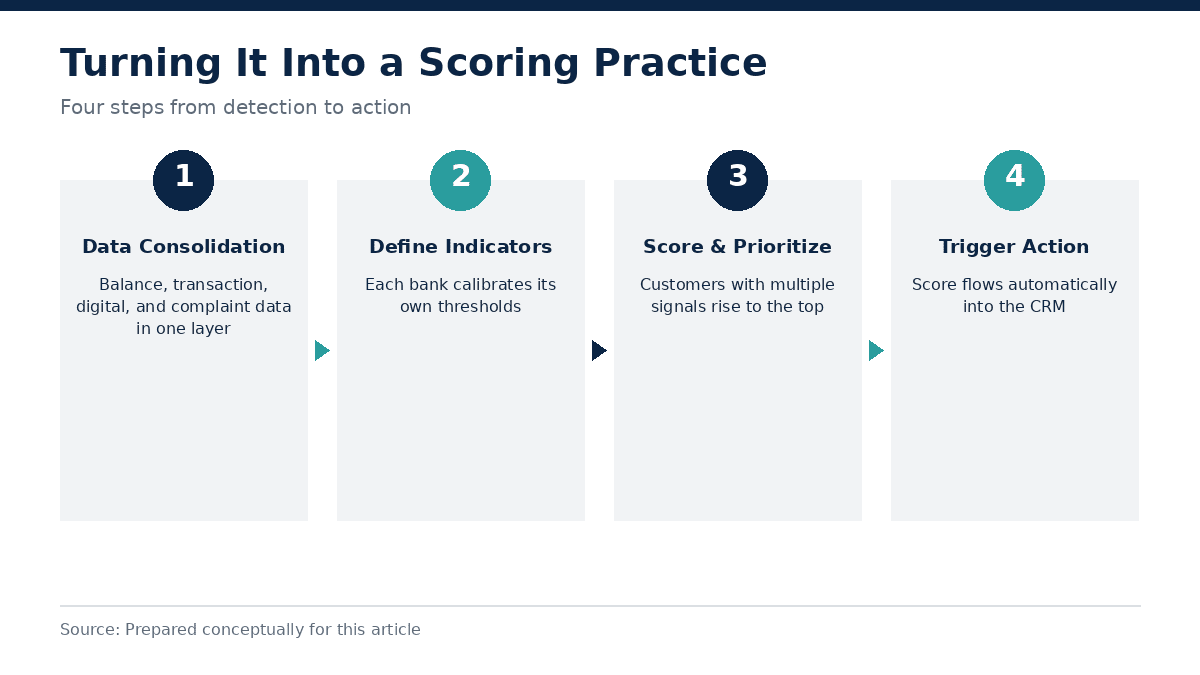
Four steps that close the gap between detection and action.
A Short Scenario: What Scoring Looks Like in Practice
To see how the four steps above play out, walk through a fictional example: this is an illustrative scenario, not real customer data.
Take a customer we’ll call John. Three years ago he had a paycheck account, a credit card, and a small investment account. Over the last eight months, three things changed: his paycheck kept landing on schedule, but a fixed amount started moving out to another bank at the start of every month; his investment account balance dropped to zero; and his mobile app logins fell from about ten a month to two.
Taken individually, each of these changes has an innocent explanation: maybe he moved his investments elsewhere, maybe he’s doing more in-branch and less on the app. But taken together (the recurring outbound transfer, the narrowing product mix, the declining digital engagement), the picture points to John gradually shifting his economic relationship to another institution. His account is still open, his card still active; this would never trip the formal definition of churn. But once a scoring model combines these three signals and crosses a threshold, the retention team gets a chance to reach out with a retention offer while there’s still a relationship left to save; once the account actually closes, that chance is gone.
This example shows why signals need to be read together rather than one at a time. It also shows why automation isn’t optional: no analyst can manually scan thousands of customers’ transaction histories looking for this kind of pattern. That’s what a systematic scoring layer is for.
What Does This Mean for Turkish and Finnish Markets?
The rapid growth of digital banking and fintech alternatives in Turkey is raising the risk that deposit and spending relationships fragment. It’s now technically far easier for a customer to keep a paycheck account at their primary bank while shifting savings or investing into a separate app, which raises the odds that silent attrition becomes a more common pattern going forward.
In a market like Finland, where digital banking is far more mature, the picture reads almost in reverse: customers tend to stay with the same bank for decades, but maintaining relationships with multiple digital providers in parallel has also become normal. In both markets the common denominator is the same: an open account is no evidence of a healthy relationship. Unless the measurement methodology is built to catch that, both markets end up with the same blind spot.
What Should Banks Actually Do?
Detection alone isn’t enough; the signal has to turn into action. What seems to work in practice falls into four categories.
First, design loyalty and reward programs around engagement, not just balance. Rewarding a customer purely for “high balance” delays noticing a customer whose balance is already draining away.
Second, treat complaint and feedback channels as an early-warning system for unresolved issues. When a customer complains at a branch or through the call center, that’s usually the first visible moment of a silent attrition process already underway; if the issue isn’t resolved right there, the customer quietly drifts away instead.
Third, move reporting from a blended rate to cohort-level dashboards. Tracking younger, digitally-oriented, and newly-opened-account segments separately surfaces early warnings the blended average hides.
Fourth, shorten the gap between detection and action. Once a customer’s risk score rises, the relevant team needs that information within days, ideally in near-real time or on a weekly cycle; the longer that gap stretches, the smaller the window to intervene.
Closing Thoughts
Silent attrition is an invisible but very real source of revenue loss in banking. The scale of the problem may be larger than most institutions assume, because standard churn metrics are structurally blind to it. The fix isn’t a new category of technology; it’s a data layer that reads the transaction data banks already have with the right signals. GTech Symphony Analytics’ Predictive Churn Management module scores this kind of behavioral risk before an account closes, giving banks time to intervene proactively.
For a bank looking to manage silent attrition, the first move isn’t buying a new tool; it’s mapping where the existing data already sits. Balance, transaction, digital channel, and complaint data are already being collected; what’s usually missing is a shared layer where they talk to each other. Once that layer exists, the signals described above start flowing automatically, and retention teams can finally step in before an account closes rather than after.
Related GTech resource: Symphony Analytics: Predictive Churn Management
Sources
Parloa, 8 bank churn reduction strategies that work in 2026
Bank Director, Patching Your Leaky Bucket: How Banks Can Address Silent Churn (March 19, 2024)
The Financial Brand, How to Uncover Hidden Pain Points that Cripple Customer Retention (November 28, 2025)
Banking Transformed podcast (Evergreen Podcasts), The Silent Attrition Crisis in Banking (May 8, 2026)
PriceWeber, Silent Attrition: 5 Ways Primary Banks Can Combat the Threat (October 21, 2025)
The Financial Brand, Acting on ‘Silent Attrition’ Is Key to Customer Loyalty in Banking (April 24, 2023)
Prepared by: GTech Data Science Team


